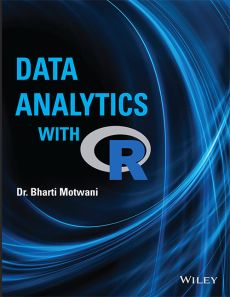
Data Analytics with R
ISBN: 9788126576463
664 pages
eBook also available for institutional users
For more information write to us at: acadmktg@wiley.com

Description
Data analysis is the method of examining, cleansing, and modeling with the objective of determining useful information for effective decision-making and operations. It includes diverse techniques and tools and plays a major role in different business, science and social science areas. R software provides numerous functions and packages for using different techniques for producing desired outcome. Data Analytics with R will enable readers gain sufficient knowledge and experience to perform analysis using different analytical tools available in R. Each chapter begins with a number of important and interesting examples taken from a variety of sectors.
PART 1 Basics of R
Chapter 1 Introduction to R
1.1 Features of R
1.2 Installation of R
1.3 Getting Started
1.4 Variables in R
1.5 Input of Data
1.6 Output in R
1.7 In-Built Functions in R
1.8 Packages in R
Chapter 2 Data Types of R
2.1 Vectors
2.2 Matrices
2.3 Arrays
2.4 Lists
2.5 Factors
2.6 Data Frame
Chapter 3 Programming in R
3.1 Decision-Making Structures
3.2 Loops
3.3 User-Defined Functions
3.4 User-Defined Package
3.5 Reports using Rmarkdown
Chapter 4 Data Exploration and Manipulation
4.1 Missing Data Management
4.2 Data Reshaping through Melting and Casting
4.3 Special Functions across Data Elements
Chapter 5 Import and Export of Data
5.1 Import and Export of Data in Text File
5.2 Import and Export of Data in Excel
5.3 Import and Export of Data in XML
5.4 Import and Export of Data in JSON
5.5 Import and Export of Data in MySQL
5.6 Import and Export of Data in SPSS
5.7 Import and Export of Data in SAS
PART 2 Visualization Techniques
Chapter 6 Basic Visualization
6.1 Pie Chart
6.2 Bar Chart
6.3 Histograms
6.4 Line Chart
6.5 Kernel Density Plots
6.6 Quantile-Quantile (Q-Q) Plot
6.7 Box-and-Whisker Plot
6.8 Violin Plot
6.9 Dot Chart
6.10 Bubble Plot
6.11 Image Plot
6.12 Mosaic Plot
Chapter 7 Advanced Visualization
7.1 Scatter Plot
7.2 Corrgrams
7.3 Star and Segment Plots
7.4 Tree Maps
7.5 Heat Map
7.6 Perspective and Contour Plot
7.7 Using ggplot2 for Advanced Graphics
PART 3 Statistical Analysis
Chapter 8 Basic Statistics
8.1 Descriptive Statistics
8.2 Table in R
8.3 Correlation and Covariance
8.4 Simulation and Distributions
8.5 Reproducing Same Data
Case Study: Web Analytics using Goal Funnels: Asset for e-Commerce Business
Chapter 9 Compare Means
9.1 Parametric Techniques
Case Study: Green Building Certification
Case Study: Comparison of Personal Web Store and Marketplaces for Online Selling
Case Study: Effect of Training Program on Employee Performance
Case Study: Effect of Demographics on Online Mobile Shopping Apps
9.2 Non-Parametric Tests
Chapter 10 Time-Series Models
10.1 Time-Series Object in R
10.2 Smoothing
10.3 Seasonal Decomposition
10.4 ARIMA Modeling
10.5 Survival Analysis
Case Study: Foreign Trade in India
PART 4 Machine Learning
Chapter 11 Unsupervised Machine Learning Algorithms
11.1 Dimensionality Reduction
Case Study: Balanced Scorecard Model for Measuring Organizational Performance
Case Study: Employee Attrition in an Organization
11.2 Clustering
Case Study: Market Capitalization Categories
Case Study: Performance Appraisal in Organizations
Chapter 12 Supervised Machine Learning Problems
12.1 Regression
Case Study: Relationship between Buying Intention and Awareness of Electric Vehicles
Case Study: Application of Technology Acceptance Model in Cloud Computing
Case Study: Impact of Social Networking Websites on Quality of Recruitment
12.2 Classification
Case Study: Prediction of Customer Buying Intention due to Digital Marketing
Chapter 13 Supervised Machine Learning Algorithms
13.1 Naïve Bayes Algorithm
Case Study: Measuring Acceptability of a New Product
13.2 k-Nearest Neighbor’s (KNN) Algorithm
Case Study: Predicting Phishing Websites
Case Study: Loan Categorization
13.3 Support Vector Machines (SVMs)
Case Study: Fraud Analysis for Credit Card and Mobile Payment Transactions
Case Study: Diagnosis and Treatment of Diseases
13.4 Decision Trees
Case Study: Occupancy Detection in Buildings
Case Study: Artificial Intelligence and Employment
Chapter 14 Supervised Machine Learning Ensemble Techniques
14.1 Bagging
Case Study: Measuring Customer Satisfaction related to Online Food Portals
Case Study: Predicting Income of a Person
14.2 Random Forest
Case Study: Writing Recommendation/Approval Reports
Case Study: Prediction of Sports Results
14.3 Gradient Boosting
Case Study: Impact of Online Reviews on Buying Behavior
Case Study: Effective Vacation Plan through Online Services
Chapter 15 Machine Learning for Text Data
15.1 Text Mining
Case Study: Spam Protection and Filtering
15.2 Sentiment Analysis
Case Study: Determining Online News Popularity
Chapter 16 Neural Network Models (Deep Learning)
16.1 Steps for Building a Neural Network Model
16.2 Multilayer Perceptrons Model (2D Tensor)
Case Study: Measuring Quality of Products for Acceptance or Rejection
16.3 Recurrent Neural Network Model (3D Tensor)
Case Study: Financial Market Analysis
16.4 Convolutional Neural Network Model (4D Tensor)
Case Study: Facial Recognition in Security Systems
Answers to Objective Type Questions
Index

