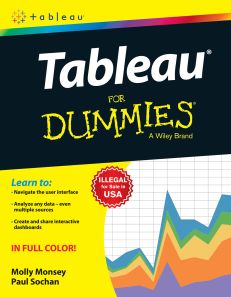
Tableau For Dummies
ISBN: 9789390466078
296 pages
PRICE CHANGE W.E.F. 26Aug'22 (Old Price Rs.799)
For more information write to us at: acadmktg@wiley.com

Description
Tell your story and put your data into action with Tableau! Tableau gives you the power to understand your data and put it in a format that is appealing and meaningful for everyone who needs to see it.
Introduction
About This Book
Part I: Getting Started with Tableau Desktop
Part II: Bringing in Data
Part III: Analyzing Data
Part IV: Publishing and Sharing
Part V: Advancing to a Higher Level
Part VI: The Part of Tens
Conventions Used in This Book
Foolish Assumptions
Icons Used in This Book
Beyond the Book
Where to Go from Here
Part I: Getting Started with Tableau Desktop
Chapter 1: A Brief Introduction to Tableau Desktop
Starting with Tableau
Downloading the Tableau trial
Installing the trial software
Looking at the Tableau Workspace
Starting Tableau
Viewing a sample workbook or data source
Seeing what Tableau can really do
Chapter 2: Seeing What You Can Do with Tableau
Analyzing Data
Looking back at data analysis
Connecting to your data in Tableau
Understanding Tableau worksheets
Starting to analyze data
Enhancing the analysis
Creating Dashboards
Telling the Story
Chapter 3 : Understanding the Basics
Getting to Know the Tableau Desktop Environment
Looking at the Tableau Start page
Understanding the Data Source Page
Using worksheets to explore data
Getting to know the Dashboard workspace
Understanding the Story workspace
Connecting to Your Data
Editing your data source
Replacing a data source
Working with Dimensions and Measures
Understanding dimensions
Understanding measures
Choosing Chart Types
Modifying Your View
Part II: Bringing in Data
Chapter 4 : Understanding Data Connections
Understanding Data Sources
Considering how data is stored
Using file-based data sources
Understanding Different Editions of Tableau Desktop
Considering Live Data versus Data Extracts
Chapter 5 : Connecting to Data
Preparing Your Data
Using the data preparation features
Targeting data sources for manual corrections
Establishing a Connection to Your Data Source
Keeping Your Data Fresh
Chapter 6 : Visualizing Data
Using the Shelves and Cards
The Columns shelf
The Rows shelf
Using a quick filter to exclude data
The Filters shelf
Pages shelf
Marks card
Modifying the View
Fitting the space
Adding annotations
Adding mark labels
Part III: Analyzing Data
Chapter 7 : Understanding the Tableau Desktop Environment
Looking at the Menus
File menu
Data menu
Worksheet menu
Dashboard menu
Story menu
Analysis menu
Map menu
Format menu
Server menu
Window menu
Help menu
Making Use of the Toolbar
Organizing Sheets
Chapter 8 : Considering Data Display Options
Using Show Me
Understanding the Chart Options in Show Me
Area charts (continuous)
Area charts (discrete)
Box-and-whisker plot
Bullet graphs
Circle views
Dual combination
Dual lines
Filled maps
Gantt
Heat maps
Highlight tables
Histogram
Horizontal bars
Lines (continuous)
Lines (discrete)
Packed bubbles
Pie charts
Scatter plots
Side-by-side bars
Side-by-side circles
Stacked bars
Symbol maps
Text tables
Treemaps
Viewing Your Data
Examining the data used in a view
Examining a subset of the data
Chapter 9: Adding Worksheets
Seeing Why Multiple Worksheets Are Useful
Naming and Organizing Worksheets
Naming worksheets
Organizing worksheets
Chapter 10: Creating Dashboards
Understanding the Purpose of Dashboards
Adding a Dashboard
Organizing Your Dashboards
Adding a logo
Adding a web page
Moving and resizing content
Ensuring Ease of Use
Synchronizing quick filters
Hiding the panel
Promoting Exploration through Actions
Using a view as a filter
Adding additional actions
Chapter 11: Building Stories
Discovering the Value of Stories
Telling Stories with Purpose
Part IV: Publishing and Sharing
Chapter 12: Publishing Workbooks
Understanding Publishing
Sharing Your Tableau Workbooks
Providing Access to Analysis
Chapter 13 : Sharing Files with Tableau Reader
Looking at the Reader App
Providing Access
Part V: Advancing to a Higher Level
Chapter 14: Advanced Visual Analytics
Using Advanced Analytics
Calculations
Parameters
Totals
Reference lines, bands, distributions, and boxes
Trend lines
Forecasting
Chapter 15: Creating Calculations
Seeing How Calculations Can Be Useful
Calculated fields
Table calculations
Creating Calculations and Parameters
Creating calculated fields
Creating table calculations and percentages
Creating parameters
Customizing Your Data with Parameters
Chapter 16: Unlocking the Language of Calculated Fields
Looking at Data Types
Understanding Functions
Considering Operators
Part VI: The Part of Tens
Chapter 17: Ten Great Tableau Tips
Don't Wait for Your Source Data to Be Perfect
Reuse Data Connections
When in Doubt, Right-Click
The Undo Button Is Your Friend
Pay Attention to Visual Cues
Leverage Your Previous Work
Visual Best Practices Are Worth Learning
Test for Performance
Keep It Simple
Save Early and Often
Chapter 18: Ten Tableau Resources
Free On-Demand Training
In-Person and Virtual Classroom Training
Community and Forums
Knowledge Base
Support
Tableau Visual Gallery
White Papers
On-Demand and Live Webinars
Events and Conferences
Tableau-Related Blogs
Index

