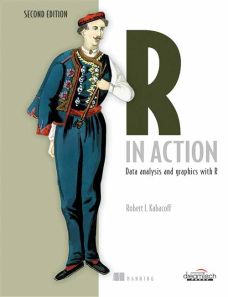
R in Action, 2ed
ISBN: 9789351198079
608 pages
Publication Year: 2015
For more information write to us at: acadmktg@wiley.com

Description
R in Action, Second Edition teaches you how to use the R language by presenting examples relevant to scientific, technical and business developers. Focusing on practical solutions, the book offers a crash course in statistics, including elegant methods for dealing with messy and incomplete data. You'll also master R's extensive graphical capabilities for exploring and presenting data visually. And this expanded second edition includes new chapters on forecasting, data mining and dynamic report writing.
Part 1 Getting started
1 Introduction to R
1.1 Why use R?
1.2 Obtaining and installing R
1.3 Working with R
1.4 Packages
1.5 Batch processing
1.6 Using output as input: reusing results
1.7 Working with large datasets
1.8 Working through an example
1.9 Summary
2 Creating a dataset
2.1 Understanding datasets
2.2 Data structures
2.3 Data input
2.4 Annotating datasets
2.5 Useful functions for working with data objects
2.6 Summary
3 Getting started with graphs
3.1 Working with graphs
3.2 A simple example
3.3 Graphical parameters
3.4 Adding text, customized axes and legends
3.5 Combining graphs
3.6 Summary
4 Basic data management
4.1 A working example
4.2 Creating new variables
4.3 Recoding variables
4.4 Renaming variables
4.5 Missing values
4.6 Date values
4.7 Type conversions
4.8 Sorting data
4.9 Merging datasets
4.10 Subsetting datasets
4.11 Using SQL statements to manipulate data frames
4.12 Summary
5 Advanced data management
5.1 A data-management challenge
5.2 Numerical and character functions
5.3 A solution for the data-management challenge
5.4 Control flow
5.5 User-written functions
5.6 Aggregation and reshaping
5.7 Summary
Part 2 Basic methods
6 Basic graphs
6.1 Bar plots
6.2 Pie charts
6.3 Histograms
6.4 Kernel density plots
6.5 Box plots
6.6 Dot plots
6.7 Summary
7 Basic statistics
7.1 Descriptive statistics
7.2 Frequency and contingency tables
7.3 Correlations
7.4 T-tests
7.5 Nonparametric tests of group differences
7.6 Visualizing group differences
7.7 Summary
Part 3 Intermediate methods
8 Regression
8.1 The many faces of regression
8.2 OLS regression
8.3 Regression diagnostics
8.4 Unusual observations
8.5 Corrective measures
8.6 Selecting the “best” regression model
8.7 Taking the analysis further
8.8 Summary
9 Analysis of variance
9.1 A crash course on terminology
9.2 Fitting ANOVA models
9.3 One-way ANOVA
9.4 One-way ANCOVA
9.5 Two-way factorial ANOVA
9.6 Repeated measures ANOVA
9.7 Multivariate analysis of variance (MANOVA)
9.8 ANOVA as regression
9.9 Summary
10 Power analysis
10.1 A quick review of hypothesis testing
10.2 Implementing power analysis with the pwr package
10.3 Creating power analysis plots
10.4 Other packages
10.5 Summary
11 Intermediate graphs
11.1 Scatter plots
11.2 Line charts
11.3 Corrgrams
11.4 Mosaic plots
11.5 Summary
12 Resampling statistics and bootstrapping
12.1 Permutation tests
12.2 Permutation tests with the coin package
12.3 Permutation tests with the lmPerm package
12.4 Additional comments on permutation tests
12.5 Bootstrapping
12.6 Bootstrapping with the boot package
12.7 Summary
Part 4 Advanced methods
13 Generalized linear models
13.1 Generalized linear models and the glm() function
13.2 Logistic regression
13.4 Poisson regression
13.5 Summary
14 Principal components and factor analysis
14.1 Principal components and factor analysis in R
14.2 Principal components
14.3 Exploratory factor analysis
14.4 Other latent variable models
14.5 Summary
15 Time series
15.1 Creating a time-series object in R
15.2 Smoothing and seasonal decomposition
15.3 Exponential forecasting models
15.4 ARIMA forecasting models
15.5 Going further
15.6 Summary
16 Cluster analysis
16.1 Common steps in cluster analysis
16.2 Calculating distances
16.3 Hierarchical cluster analysis
16.4 Partitioning cluster analysis
16.5 Avoiding nonexistent clusters
16.6 Summary
17 Classification
17.1 Preparing the data
17.2 Logistic regression
17.3 Decision trees
17.4 Random forests
17.5 Support vector machines
17.6 Choosing a best predictive solution
17.7 Using the rattle package for data mining
17.8 Summary
18 Advanced methods for missing data
18.1 Steps in dealing with missing data
18.2 Identifying missing values
18.3 Exploring missing-values patterns
18.4 Understanding the sources and impact of missing data
18.5 Rational approaches for dealing with incomplete data
18.6 Complete-case analysis (listwise deletion)
18.7 Multiple imputation
18.8 Other approaches to missing data
18.9 Summary
Part 5 Expanding your skills
19 Advanced graphics with ggplot2
19.1 The four graphics systems in R
19.2 An introduction to the ggplot2 package
19.3 Specifying the plot type with geoms
19.4 Grouping
19.5 Faceting
19.6 Adding smoothed lines
19.7 Modifying the appearance of ggplot2 graphs
19.8 Saving graphs
19.9 Summary
20 Advanced programming
20.1 A review of the language
20.2 Working with environments
20.3 Object-oriented programming
20.4 Writing efficient code
20.5 Debugging
20.6 Going further
20.7 Summary
21 Creating a package
21.1 Nonparametric analysis and the npar package
21.2 Developing the package
21.3 Creating the package documentation
21.4 Building the package
21.5 Going further
21.6 Summary
22 Creating dynamic reports
22.1 A template approach to reports
22.2 Creating dynamic reports with R and Markdown
22.3 Creating dynamic reports with R and LaTeX
22.4 Creating dynamic reports with R and Open Document
22.5 Creating dynamic reports with R and Microsoft Word
22.6 Summary

